.webp)
.webp)
.webp)
.webp)
.webp)
.webp)
.svg)
.svg)
.png)


%201.svg)

How to Use the Amazon Search Query Report to Maximize Performance
Published
February 15, 2023
Updated
July 3, 2023


What is the Amazon Search Query Report?
Amazon launched the Search Query Report last year to all brand-registered sellers on Amazon Seller Central. (Amazon Vendor Central does not yet have access.) The report can be pulled on a weekly, monthly, and quarterly basis to show you first-party data on the search queries customers are using to find your brand's products on Amazon.
The terms that appear in the report—and their correlated data—only represent queries that originate from the Amazon search bar and drive clicks on the search results. That means outside traffic, editorial recommendations, highly rated/top rated snippets, clicks from other product pages, and other non-search bar paths are not included in the report.


What Metrics are Provided in the Amazon Search Query Report?
The Amazon Search Query Report provides dozens of metrics throughout the funnel, including impressions, clicks, cart adds, and purchases. Here's an overview of all of them, along with their definitions.
General definitions
- Search Query Score: Orders the queries from top performance to lowest performance. Amazon shares the top 1,000 scored queries. This column cannot be hidden.
- Search Query: The query searched by customers. This column cannot be hidden.
- Search Query Volume: The number of times this query was searched during the selected time period.
- Same-Day Shipping Speed: Same-day shipping speed means customers receive the products within the same day after purchasing. This metric captures the number of times ASINs with the same-day delivery message are "impressed/clicked/cart-added/purchased" in the search results page for the specific query. Amazon propagates shipping speed at the time of impression to all downstream actions such as click, add, and purchase.
- 1D Shipping Speed: One-day or next-day shipping captures the number of times ASINs with "One-Day" delivery message are "impressed/clicked/cart-added/purchased" in the search results page for the specific query. Amazon propagates shipping speed at the time of impression to all downstream actions such as click, add, and purchase.
- 2D Shipping Speed: This metric captures the number of times ASINs with "Two-Day" delivery message are "impressed/clicked/cart-added/purchased" in the search results page for the specific query. Amazon propagates shipping speed at the time of impression to all downstream actions such as click, add, and purchase.
- Price (Median): Median price across all of the ASINs for the query, at the time of impression.
- Brand Price (Median): Median price across all of the brand's ASINs for the query, at the time of impression.
Search funnel impressions
- Total Count: The number of ASINs impressed for the query originated from the search result
- Brand Count: Total number of impressions from the brand's catalog impressed for this query
- Brand Share: Percentage share of impressions from the brand's catalog compared to the total count for the query
- ASIN Count: The total number of ASIN impressions for this query
- ASIN Share: Percentage share of impressions attributed to the ASIN compared to the total count for the query
Search funnel—clicks
- Total Count: The number of ASINs clicked for the query originated from the search result
- Brand Count: Total number of clicks from the brand's catalog for this query
- Brand Share: Percentage share of clicks from the brand's catalog compared to the total count for the query
- Click-Through Rate (CTR): The total number of clicks over search query volume count
- ASIN Count: The total number of ASIN clicks for this query
- ASIN Share: Percentage share of clicks attributed to the ASIN compared to the total count for the query
Search funnel—cart adds
- Total Count: The number of ASINs cart-added for the query originated from the search result
- Brand Count: Total number of cart-adds from the brand's catalog for this query
- Brand Share: Percentage share of cart-adds from the brand's catalog compared to the total count for the query
- Cart Add Rate: The total number of cart adds over search query volume count
- ASIN Count: The total number of the ASIN added to the cart for this query
- ASIN Share: Percentage share of cart adds attributed to the ASIN compared to the total count for the query
Search funnel—purchases
- Total Count: The number of purchase actions that happened for the query, originated from the search result
- Purchase Rate: The total number of purchases over search query volume count
- Brand Count: Total number of purchase actions from the brand's catalog for this query
- Brand Share: Percentage share of purchase actions from the brand's catalog compared to the total count for the query
- ASIN Count: ASIN Count only includes purchases from the selected ASIN for the query
- ASIN Share: Percentage share of purchase actions attributed to the ASIN compared to the total count for the query
How to Use Amazon Search Query Report Data
Identify search term share opportunity
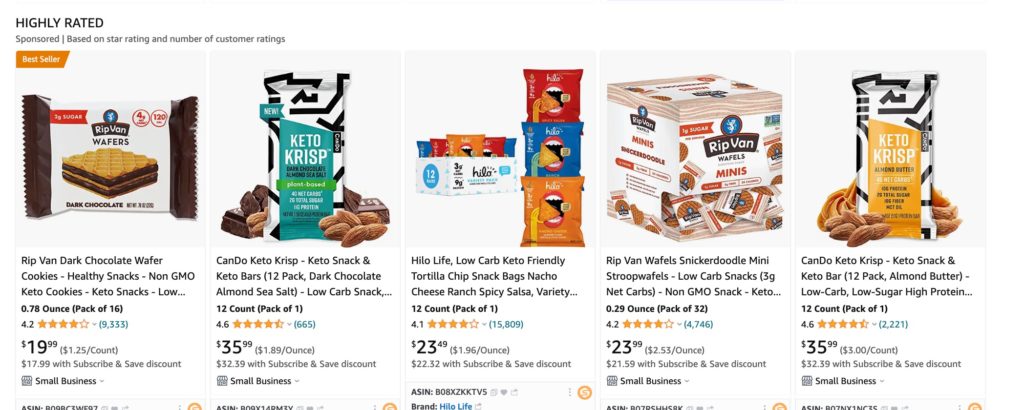
When pulling weekly data, you’ll be able to see how your brand stacks up against competitors for your primary keywords through the Brand Share metric on clicks, add-to-carts, and purchases. This is a crucial metric to watch when you're running top-of-search bid modifiers to gain market share, since Amazon Ads reporting can be delayed, making it difficult to determine if your organic sales are increasing even though your ROAS on ads may be less than one.
We use the Brand Share metric to gauge whether our ad spend was worth it. For example, let's say you want to rank higher for the search term “keto snacks” for an item you sell for $20. You increase your bids and budget to $3,000 for the week and maintain a 30% top-of-search impression share for the term, but your ACOS is 300% on 50 orders that week.
You may also like: The Complete Guide to Increasing Sales on Amazon
Before the Search Query Report was available, you would more than likely turn off the ads or start decreasing bids; most people weren’t looking closely at the correlation between organic search position and organic sales. But with that increase in spend, you moved organically from position 15 to position five. And once you pull that week’s Search Query Report, you’ll be able to see just how much your organic position increased organic sales.
Continuing with the same example, let’s assume you increased your organic sales by 50 units over the prior week. You would now have a total of $2,000 in sales and a TACOS of 150%, which is a great improvement. But since your organic rankings didn’t start increasing until midway through the week, there will be three more days of organic lift the following week, assuming everything holds and you continue to spend.
So you continue to spend the following week at your elevated level from the prior week and move to position two organically. Upon completion of the week, you pull your Search Query Report to see that organic sales drove 165 units and ads drove 50 units. This brings your TACOS down to 70% and allows you to start pulling back on spend on the term for the next week since your organic ranking will continue to carry the product through the next week.
Prior to the launch of the Amazon Search Query Report, this type of analysis was, at best, guesswork. It required pulling multiple data points from Amazon and third-party tools like Helium 10 to do an analysis—it was challenging to have a high degree of confidence in that analysis and even more difficult to convince clients to continue funding the ad spend.
Develop product ranking campaigns
When aiming to boost product rankings on Amazon, many sellers have historically looked to Jungle Scout and Helium 10 to provide them with daily sales estimates for the terms they were targeting. Sellers would then formulate a plan to calculate the number of customers they needed to drive to their pages to match trends of similar top selling products for that keyword.
Now sellers can blend the Amazon Search Query Report and Brand Analytics together to get the optimal inputs needed for ranking campaigns.
Let’s take the same keyword from above, “keto snacks.” We can see from Brand Analytics that the second most clicked item is getting 8.46% of the click share and 10.73% of the conversions.

From the Search Query Report, we can see that this term had 11,133 clicks and 1,490 purchases last week.


To estimate sales, we can simply merge the data by multiplying their Click Share by Total Clicks and Conversion Share by Total Purchases.
This gives us 942 clicks and 160 purchases. From here, we can estimate a conversion rate of 17% and an average of 22 sales per day for this term. To rank higher than them for this term, we will need to match and beat their metrics.
A simple strategy for this is to determine the daily budget we'd need to achieve this goal. We start by dividing the daily sales needed by the conversion rate of the item we are trying to mirror.
22/.17 = 130 clicks needed to produce 22 sales.
Next, we’ll look at our average CPC over the past few weeks—let’s say it is $1.90 for this term. We’d need to multiply the number of clicks required by the CPC.
130*1.90 = $247 per day in ad spend to meet the minimum needed to rank.
We typically add 10–15% on to this budget to ensure there is enough spend even if CPCs increase or the conversion rate is lower than expected.
Next, we’d repeat this process for all of the keywords we’re targeting for increasing our organic rankings. Typically we focus on 10–15 at a time, depending on the search volume and total budget for the product.
Then we'll set up ad campaigns—similar to the ones above—and track the performance on a daily basis, watching organic rankings and comparing Amazon Search Query Report data week over week to ensure we're seeing results.
Since the data will change each week, it's best to recalculate the number of clicks and sales needed every time there is a new reporting period for the Search Query Report. That allows us to maximize our budget and potential for success on our ranking campaigns.
Wrapping Up
The Amazon Search Query Report is by far the most data Amazon has ever freely given to sellers, and it’s a game changer for those who use it wisely. Test the above techniques for improving your performance and let us know what results you’re seeing. We’ll be sharing additional tips and tricks for using the Search Query Report in the coming weeks, so make sure you follow us on LinkedIn and sign up for our newsletter below.
Interested in upleveling your Amazon strategy? Reach out to growth@rightsideup.co—we’d love to talk shop.


.webp)
.webp)
.webp)
.webp)
.webp)
.webp)