.webp)
.webp)
.webp)
.webp)
.webp)
.webp)
.svg)
.svg)
.png)


%201.svg)

How to Use the Amazon Search Query Report to Maximize Performance
Published
February 15, 2023
Updated
September 23, 2025


Summary
- The Amazon Search Query Performance (SQP) Report provides first-party insights into keyword performance (e.g., clicks, impressions, and conversions), as well as data on how a brand’s products perform for those keywords.
- By strategically reviewing this data, brands can make informed decisions on budget allocation and ranking improvements.
- Insights from the report can help brands uncover search term share opportunities and compare performance with competitors.
- Brands can also develop optimized product ranking campaigns by tracking click share and conversion share—and estimating the ad spend needed to achieve ranking goals.
- The report is updated weekly, allowing brands to regularly reassess performance and make data-driven adjustments to campaigns and ad spend.
What is the Amazon Search Query Report?
A few years ago, Amazon launched the Search Query Performance report (SQP) to all brand-registered sellers on Amazon Seller Central. (Amazon Vendor Central does not yet have access.)
This report offers insights into the performance of specific search queries on Amazon’s marketplace, providing both general-level data (e.g., total search volume) and details related to a brand’s listings (e.g., clicks to one of your products). New data can be pulled on a weekly, monthly, or quarterly basis.
By analyzing metrics like impressions, clicks, and purchases, brands can better understand what searches are effectively driving customers to product pages, and in turn optimize their keyword and listing strategy.
Where does the report’s data come from?
The terms that appear in the report—and their correlated data—only represent queries that originate from the Amazon search bar and drive clicks on the search results.
That means outside traffic, editorial recommendations, highly rated/top rated snippets, clicks from other product pages, and other non-search bar paths are not included in the report.


How to Use Amazon Search Query Performance Report Data (with Examples)
A lot of data is available within the SQP report, and while that’s never a bad thing, knowing where to start can be challenging. Let’s go through two of the most impactful ways to use the report.
Identify search term share opportunity
By looking at Brand Share insights, you’re able to see how your brand stacks up against competitors for primary keywords in terms of clicks, add-to-carts, purchases, and other metrics.
And as a reminder, you can do this as often as every week—and you should, especially when running top-of-search bid modifiers to gain market share. Let’s go over an example.
You may also like: The Complete Guide to Increasing Sales on Amazon
Scenario: You increased bids and budget to rank higher, but your ACOS went through the roof
Say you wanted to rank higher for the search term “keto snacks” for a product you sell for $20. You decide to increase your bids and budget to $3,000 for the week and aim for a 30% top-of-search impression share for the term.
But after the week, you see that your ACOS (Advertising Cost of Sale) is at 300% for 50 orders. Ouch!
Before the Search Query Performance Report was available, you would’ve likely just turned off the ads or lowered your bids—and that would’ve been the end of it.
But now, with the report, you can dig deeper and see exactly how your organic search position and organic sales are related.
Step 1: Understand your organic rank shift
In this scenario, you discover that your increased spend helped move your organic ranking from position 15 to position 5. And, better yet, you can also see exactly how much organic sales increased as a result of your improved position.
Step 2: Calculate the impact on sales
Let’s assume your organic sales increased by 50 units compared to the prior week. That’s an extra $1,000 in sales, bringing your total sales to $2,000. Your TACOS (Total Advertising Cost of Sale) drops to 150%, a nice improvement.
Step 3: Project future performance
Since your organic rankings didn’t really pick up until halfway through the week, you know there’s still potential for more growth. There are three more days of organic lift to come next week, assuming you continue to spend at the same level.
Step 4: Continue the strategy
You decide to keep your spend elevated for the following week, which helps push your product to position 2 organically. By the end of the week, you pull your report and see that organic sales have driven 165 units, while your ads drove 50 units.
Now, your TACOS is down to 70%, which means you can start reducing your spend on the term. The product’s higher organic ranking will continue to drive sales without needing as much paid support.
This type of analysis is only possible with the SQP Report
Before the Search Query Performance Report existed, this type of analysis was mostly guesswork. You’d have to pull data from multiple sources, including third-party tools like Helium 10—and even then, the analysis was often unreliable.
Now, with the SQP Report, you can directly correlate ad spend with organic rankings and sales, allowing for more strategic decision-making and clearer justification of your ad spend.
Developing optimized product ranking campaigns
Let’s go through a step-by-step process of developing product ranking campaigns using the Search Query Performance Report. We’ll continue with the keyword “keto snacks” as our example.
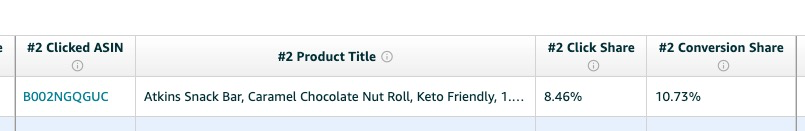
Step 1: Analyze click share and conversion share to estimate sales
- From Brand Analytics, we see that the second most clicked item for “keto snacks” is getting 8.46% of the click share and 10.73% of the conversions.
- The Search Query Performance Report shows this term had 11,133 clicks and 1,490 purchases last week.
- We estimate sales by multiplying Click Share by Total Clicks and Conversion Share by Total Purchases:
- 8.46% of 11,133 clicks = 942 clicks
- 10.73% of 1,490 purchases = 160 purchases
- This gives us an estimated conversion rate of 17% (160 ÷ 942) and 22 sales per day (160 sales ÷ 7 days).


Step 2: Set the goal to rank higher
To rank higher for this term, we need to match and exceed their metrics. To produce 22 sales per day, we’ll need 130 clicks per day (22 ÷ 0.17 conversion rate).
Step 3: Calculate the daily ad spend
Given an average CPC of $1.90, we multiply the required clicks by the CPC: 130 clicks × $1.90 = $247 per day in ad spend to meet the goal.
Step 4: Add buffer and repeat for other keywords
We add a 10-15% buffer to the budget to account for fluctuations in CPC and conversion rates. This same process is repeated for other targeted keywords, usually around 10-15 keywords, depending on the search volume and budget.
Step 5: Launch campaigns and track performance
Set up your ad campaigns for each target keyword, then monitor them daily. Track organic rankings and compare the SQP Report data week over week to ensure improvements.
Step 6: Adjust based on data
Since data changes weekly, recalculate the required clicks, sales, and budget after each new SQP report period. Adjust your strategy to optimize ad spend and maximize organic ranking success.
What Metrics Are Provided in the Amazon Search Query Performance Report?
The Amazon Search Performance Query Report provides dozens of metrics throughout the funnel, including impressions, clicks, cart adds, and purchases. Here's an overview of all of them.
General definitions
- Search Query Score: Orders the queries from top performance to lowest performance. Amazon shares the top 1,000 scored queries. This column cannot be hidden.
- Search Query: The query searched by customers. This column cannot be hidden.
- Search Query Volume: The number of times this query was searched during the selected time period.
- Same-Day Shipping Speed: Same-day shipping speed means customers receive the products within the same day after purchasing. This metric captures the number of times ASINs with the same-day delivery message are "impressed/clicked/cart-added/purchased" in the search results page for the specific query. Amazon propagates shipping speed at the time of impression to all downstream actions such as click, add, and purchase.
- 1D Shipping Speed: One-day or next-day shipping captures the number of times ASINs with "One-Day" delivery message are "impressed/clicked/cart-added/purchased" in the search results page for the specific query. Amazon propagates shipping speed at the time of impression to all downstream actions such as click, add, and purchase.
- 2D Shipping Speed: This metric captures the number of times ASINs with "Two-Day" delivery messages are "impressed/clicked/cart-added/purchased" in the search results page for the specific query. Amazon propagates shipping speed at the time of impression to all downstream actions such as click, add, and purchase.
- Price (Median): Median price across all of the ASINs for the query, at the time of impression.
- Brand Price (Median): Median price across all of the brand's ASINs for the query, at the time of impression.
Search funnel impressions
- Total Count: The number of ASINs impressed for the query originated from the search result
- Brand Count: Total number of impressions from the brand's catalog impressed for this query
- Brand Share: Percentage share of impressions from the brand's catalog compared to the total count for the query
- ASIN Count: The total number of ASIN impressions for this query
- ASIN Share: Percentage share of impressions attributed to the ASIN compared to the total count for the query
Search funnel—clicks
- Total Count: The number of ASINs clicked for the query originated from the search result
- Brand Count: Total number of clicks from the brand's catalog for this query
- Brand Share: Percentage share of clicks from the brand's catalog compared to the total count for the query
- Click-Through Rate (CTR): The total number of clicks over search query volume count
- ASIN Count: The total number of ASIN clicks for this query
- ASIN Share: Percentage share of clicks attributed to the ASIN compared to the total count for the query
Search funnel—cart adds
- Total Count: The number of ASINs cart-added for the query originated from the search result
- Brand Count: Total number of cart-adds from the brand's catalog for this query
- Brand Share: Percentage share of cart-adds from the brand's catalog compared to the total count for the query
- Cart Add Rate: The total number of cart adds over search query volume count
- ASIN Count: The total number of the ASIN added to the cart for this query
- ASIN Share: Percentage share of cart adds attributed to the ASIN compared to the total count for the query
Search funnel—purchases
- Total Count: The number of purchase actions that happened for the query, originated from the search result
- Purchase Rate: The total number of purchases over search query volume count
- Brand Count: Total number of purchase actions from the brand's catalog for this query
- Brand Share: Percentage share of purchase actions from the brand's catalog compared to the total count for the query
- ASIN Count: ASIN Count only includes purchases from the selected ASIN for the query
- ASIN Share: Percentage share of purchase actions attributed to the ASIN compared to the total count for the query
Wrapping up
The Amazon Search Query Performance Report is by far the most data Amazon has ever freely given to sellers, and it’s a game changer for those who use it wisely. Test the above techniques for improving your performance and let us know what results you’re seeing.
Interested in upleveling your Amazon strategy? Reach out—we’d love to talk shop.


.webp)
.webp)
.webp)
.webp)
.webp)
.webp)